What is Demand?
June 2011
 |
|
Demand Analogy Basics | |
|
You may have noticed the difference in fuel efficiency (m.p.g.) when you drive on the highway versus in the city. Your car’s miles per gallon increase when driving on the highway. This occurs because you are driving at a consistent speed and you are taking advantage of momentum. There are no stop signs or traffic lights, so your use of energy (gas) is at a fairly stable rate. When driving in the city your vehicle is frequently accelerating and decelerating, making it difficult to take advantage of momentum. Many people try to improve the efficiency of city driving by slowly accelerating when a light turns green instead of “pushing the pedal to the metal.” This saves some small amount of fuel but doesn’t drastically improve mileage like highway driving at a constant speed. |
|
|
You may have noticed the difference in fuel efficiency (m.p.g.) when you drive on the highway versus in the city. Your car’s miles per gallon increase when driving on the highway. This occurs because you are driving at a consistent speed and you are taking advantage of momentum. There are no stop signs or traffic lights, so your use of energy (gas) is at a fairly stable rate. When driving in the city your vehicle is frequently accelerating and decelerating, making it difficult to take advantage of momentum. Many people try to improve the efficiency of city driving by slowly accelerating when a light turns green instead of “pushing the pedal to the metal.” This saves some small amount of fuel but doesn’t drastically improve mileage like highway driving at a constant speed. | |
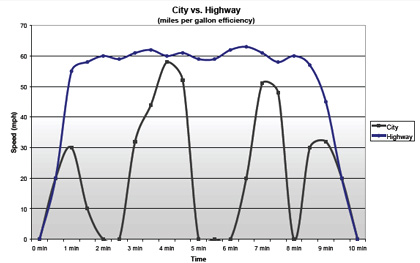
This graph depicts the typical speeds of driving in the city versus on the highway for 10 minutes. As you can see, once you reach the desired speed on the highway (blue line) your speed stays fairly consistent. The peaks and valleys of city driving (gray line) are caused by the “stop and go” of traffic lights and stop signs which decreases your fuel efficiency. The same can be said of your building’s energy use. The more extreme peaks and valleys you have, the less efficient your use of electricity is. Although this graph may not replicate what your energy use looks like, it’s easier to grasp the concept of inefficiency through this analogy. The objective is to utilize momentum to improve efficiency. |
 |
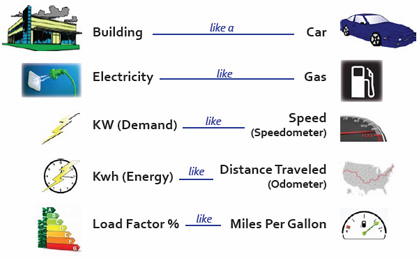
Demand ControlWe are in the business of demand control, and helping people learn how to “highway drive” when it comes to their building’s electric use. Demand control isn’t about controlling the amount of electricity (gas) consumed, but instead how efficiently it’s consumed (m.p.g). The issue most people face in high electric costs is “pushing the pedal to metal” when it comes to their electric use. They are unaware that they are “city driving” vs. “highway driving” with their building. Demand is defined as the rate of electric use. In our car analogy, demand is the speed at which your building is using electricity. Utilities bill your electric use based on a combination of the amount of energy consumed (kWh/ gas) and the rate at which it was consumed (kW/ speed). kW is how demand is measured, and most utilities bill for the “Peak Demand” which is the highest demand in any one demand interval (usually 15 minutes) during the billing month. | |
 |
So how can you “highway drive” with your building?Keep your demand (speed) steady! You can manually control your large non-critical electric loads, or you can have an Energy Sentry automatically do it for you. |
|
An Energy Sentry demand management system is kind of like a cruise control for building’s electric use. Your larger controllable loads, such as air conditioning, are automatically cycled on and off on a priority basis. This keeps yo below a certain kW threshold, and ensures your energy use remains at stable levels leaving you with less peaks and valleys and lower electric bills! |
|
If you would like to know more about Energy Sentry demand management systems, contact the experts at Brayden Automation Corp. (888) 272-9336.

