Dispelling the Myth: How Peak Demand REALLY Occurs
October 2011
|
There is a common misunderstanding out there about how Peak Demand occurs and is really measured. Well we’re here to set the record straight! Many times, we hear “The instant I turn on my air conditioner, (or other large electric load) that instantaneous start-up spike sets my peak.” Although that’s commonly thought of as the Peak Demand, it’s not. Here’s why: | |
 |
When switched on, inductive machines (machines with motors) will initially use a large amount of energy to begin turning the motor that is used to power the machine. The initial current draw of the motor is called the Locked Rotor Amps (LRA). Once the motor gains momentum it drops down to a steady pace referred to as the Run Load Amps (RLA) or the static load size. The LRA is what is commonly thought of as “setting the peak” as mentioned in the statement above. In actuality, the LRA occurs for such a short period of time it has very little energy content and thus very little effect on the Peak Demand. |
Air Conditioner ExampleTo better understand this concept, let’s look at an example of a single-phase 240 Volt 21 AMP Air Conditioner that has a LRA of .0098 kwh/s and a RLA of .0014 kwh/s. *the LRA is normally 7 times the amount of the RLAThis graph shows the first 10 seconds of the air conditioner’s electric use in kWhs. |
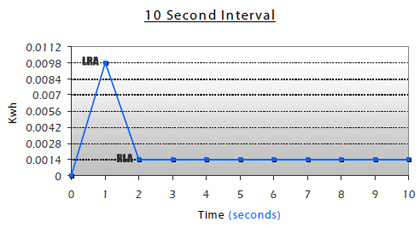 |
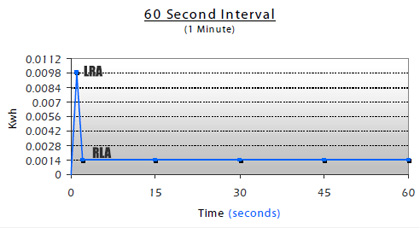
In the first second of use, there is an initial spike where the current energizes the motor windings and tries to begin turning the motor in the air conditioner (LRA). As the motor gains momentum, energy needed decreases and drops down to the RLA. If we were to look at the first 60 seconds of use it would look like the graph to the right. The amount of energy use is staying constant at the static load size (RLA). At this point the air conditioner will remain at the RLA of .0014 kwh/s unless it is turned off. |
|
Refresher on Peak DemandIn our June newsletter we briefly touched on the topic of “What is Demand” and how you are billed for it. To recap, most commercial customers and some residential customers (depending on the utility) are billed a “Demand Charge”. The Demand Charge is the amount you pay, per kW, during the billing month for the “Peak Demand.” The Peak Demand is the highest kWh usage in any demand interval (usually 15 minutes) during the billing month. It determines not only your Demand Charge but may also determine what rate you’re placed on by the utility. The utility’s meter records and averages your kWh use for each of those 15-minute intervals and the interval with the highest 15-minute usage, in that billing period, sets your peak demand for that month. | |
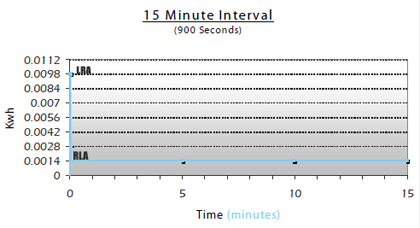
The 15-Minute IntervalTo reiterate, the Peak Demand is not the highest instantaneous kW spike that occurs during the billing month, it is the highest averaged 15-minute period that occurs within the billing month. So if we go back to our example of the air conditioner, and look at its use in a 15-minute period it would look like the graph to the right: |
|
|
The one second energy spike of .0098 kWh, has very little effect on the 15-minute interval average when the remaining 899 seconds are at .0014 kWh. It is very unlikely that one air conditioner will be the only electric load in operation. However, the concept of how little the turn-on spike effects the Peak Demand is present. Basically, that spike is averaged out as somewhat of a “glitch” because it happens for such a brief period of time. If you were to calculate demand in a 15-minute interval at a constant rate of .0014 it would average out at 5.04kW. When adding the brief one second spike, the demand only increases to about 5.07kW. This is a very minuscule difference when you consider most situations have several electric loads impacting the demand at much larger scales. | |
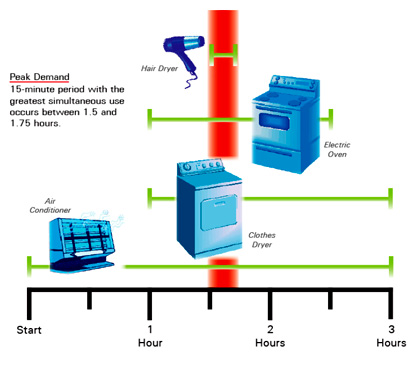
Spotting the PeakWhen studying Peak Demand it is essential to take into consideration all the electric loads in operation and when they are operating. The example to the right displays a 3-hour timeline of three larger electric loads and one smaller load in use at various times. As mentioned above, Peak Demand occurs in the highest averaged 15-minute period. In this case it would most likely occur between 1.5 and 1.75 hours when all the loads are being used as the same time. *Take note that this is not when the larger loads are being turned on (when turn-on spikes occur). |
 |
Take-Away
| |
Hopefully, we have set the record straight about turn-on spikes and how little they affect Demand. If you would like to know more about how demand is calculated or how to lower your Peak Demand, contact the experts at Brayden Automation Corp. (888) 272-9336.